Solutions

We have a solution for everything – and the corresponding experience. In our current seven areas of expertise, we are at your disposal with our comprehensive know-how.

All Solutions

Software solutions

Software solutions

With our Werum PAS-X MES - on premise or cloud-based - and our software solutions for analysis, track & trace, networked factories, and intelligent packaging, we are the world's leading supplier and partner to the pharmaceutical and biotech industries.

Overview Software solutions

Handling systems

Handling systems

We are specialists for complete handling systems for pharmaceutical and medical products. Our solutions are decisive in the field of contactless and safe transport of e.g. glass syringes.

Overview Handling systems

Inspection machines

Inspection

As the world's leading inspection expert, we develop solutions for the pharmaceutical and biotech industries. Our range of products extends from high-performance machines and semi-automatic machines to laboratory units and inspection applications for in-process control.

Overview Inspection

Machine finder

Packaging machines

Packaging machines

We are a leading supplier of packaging machines for liquid and solid pharmaceutical and medical products. With our blister, sachet and stick packaging machines we offer solutions for primary packaging. Our side and topload cartoners set standards worldwide for secondary packaging.

Overview Packaging machines

K.Pak Topload Case Packer

Introducing our latest solution from Körber; the K.Pak Topload Case Packer! Created specifically for the pharmaceutical industry, the K.Pak solution provides operator-friendly machines to complete any production line. Our solution focuses on innovative technology, high-quality design and expert handling and packaging of your product. It’s time to start connecting the dots with Körber!

Packaging solutions

Packaging solutions

As long-standing specialists, we develop packaging solutions for innovative and high-quality secondary pharmaceutical packaging made of cardboard. We offer you solutions for counterfeit protection, standard folding boxes and much more.

Overview Packaging solutions

Consulting

Consulting

Our experts will advise you during the analysis of your requirements, show you optimisation potential and support you during the implementation of projects in all areas of the pharmaceutical, biotech and medical device industry.

Overview Consulting

Thomas Zahel

Blog

The biggest flaws in setting a control strategy in biopharmaceutical manufacturing

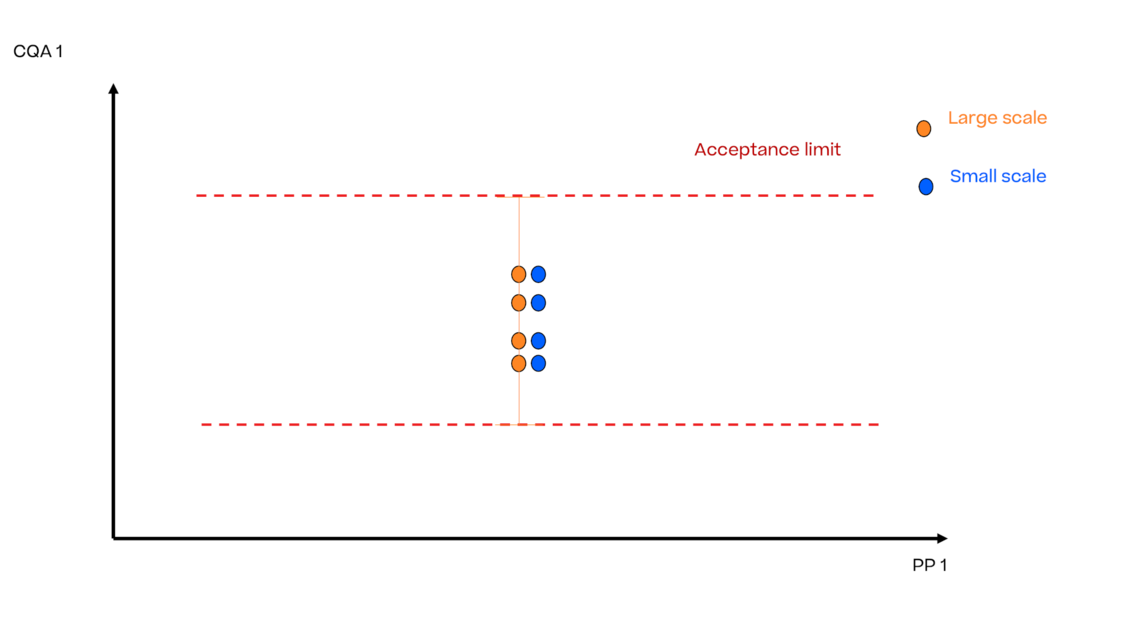
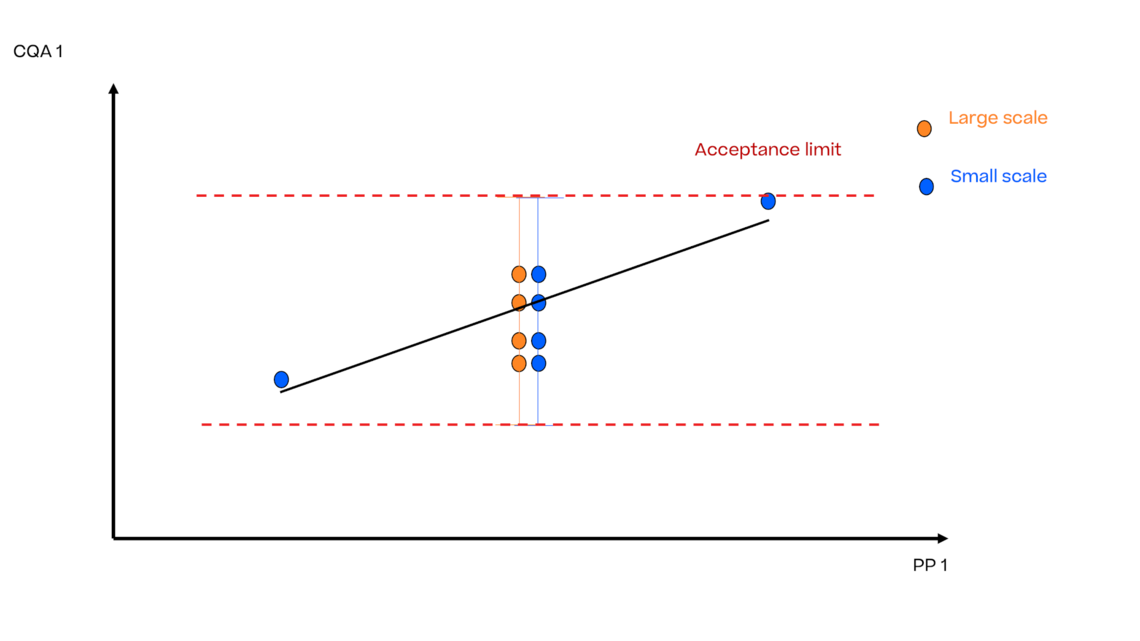
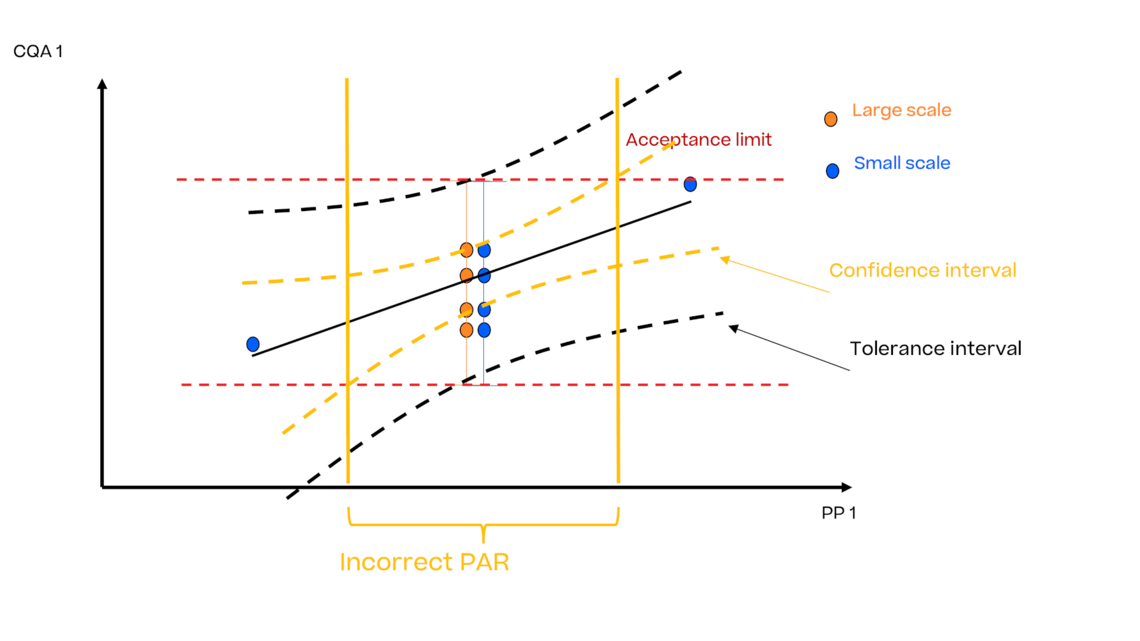
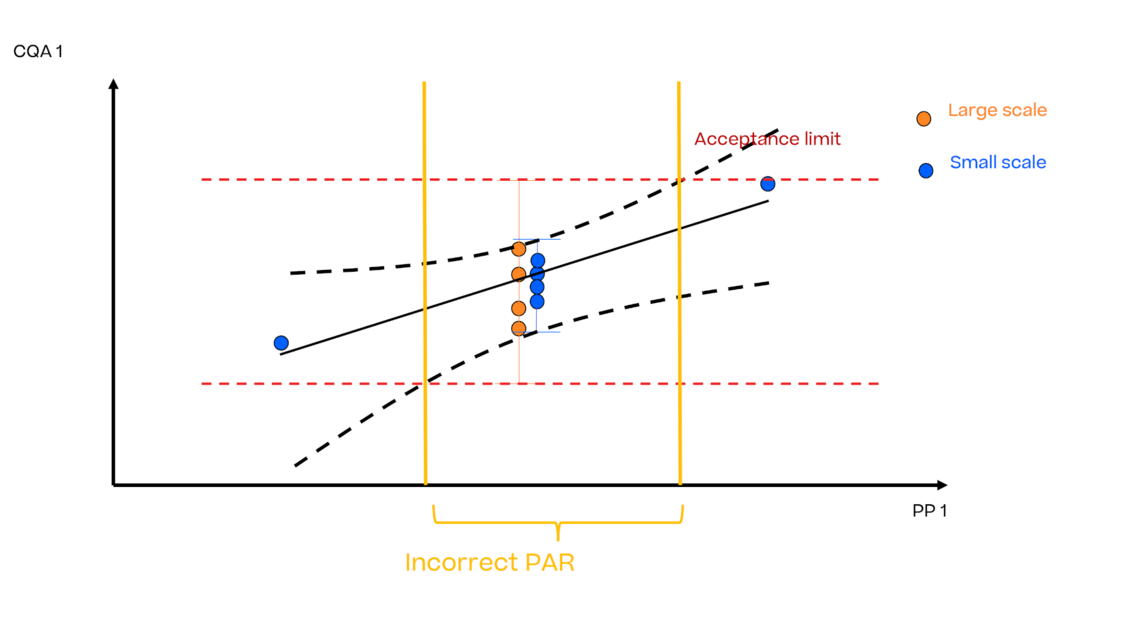
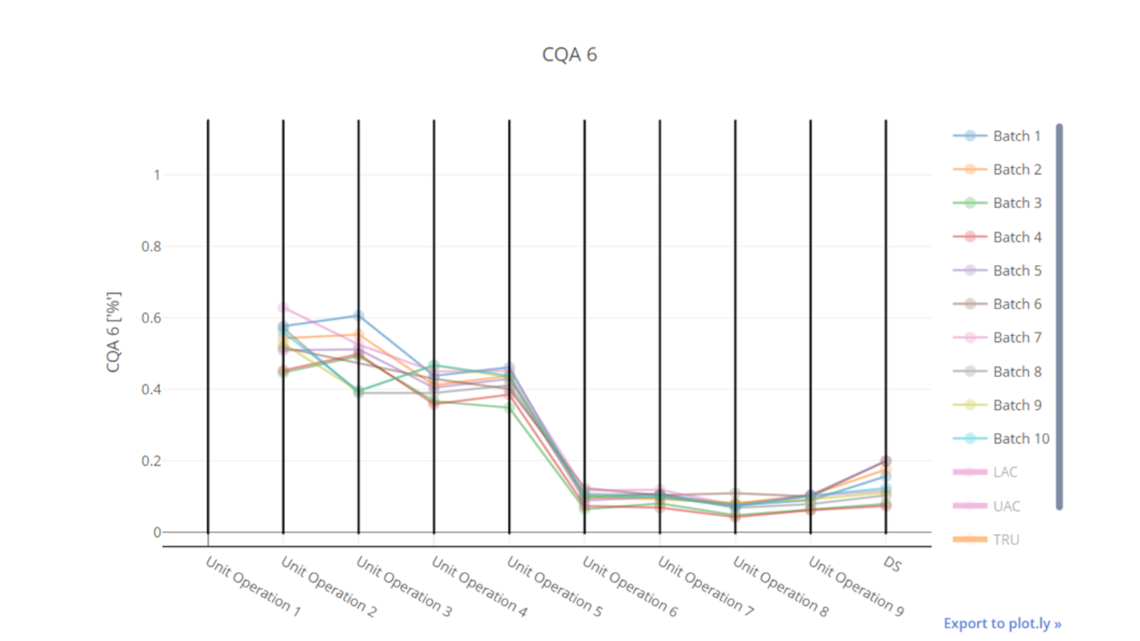
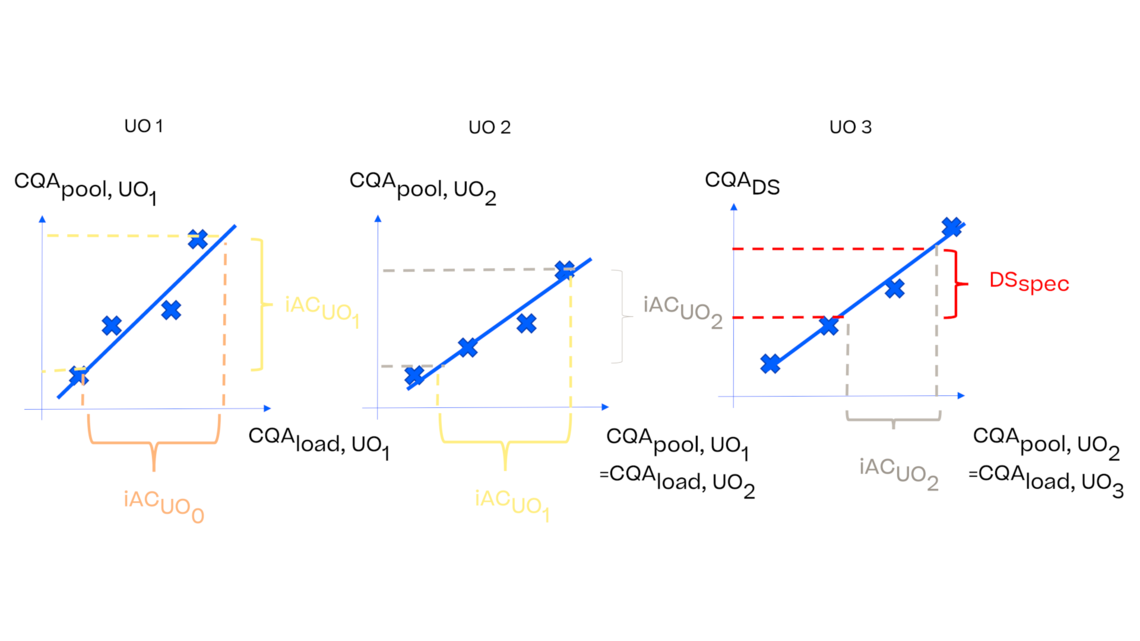
In this article we want to demonstrate one of the biggest flaws in setting control strategies in biopharmaceutical manufacturing. This is linked to the fact that people still set specifications, either drug substance specification, or intermediate acceptance criteria/ in process controls, based on a x-SD approach. Moreover, we want to demonstrate sound tools that enable a data driven establishment of those limits and herein derived control strategies (Marschall et al., 2022). 

This article mainly focuses on examples from biopharmaceutical manufacturing but can be applied without loss of generality to other pharmaceutical and chemical processes.

Learn more

A common data based approach to ICH compliant control strategy

In a typical process development or process characterization, experiments on individual unit operations are performed to identify why process parameter settings lead to acceptable product quality. Efficient technologies such as statistical experimental design (DoE) can be used to reach maximum information gain with minimum number of experiments. Based on the identified relationship between process inputs such as process parameters and critical material attributes, and outputs - typically critical quality attributes (CQAs) – a control strategy on the inputs can be defined. 

A typical data driven approach is to intersect the model uncertainty and the acceptance limits to come up with proven acceptable range as described in ICH Q8.

It becomes immediately obvious that acceptance limits are the gate keepers and determine:

  • How many runs need to be planned?
  • How good does my analytics need to be?
  • How wide will my control strategy be? → operational flexibility

Those acceptance limits need to be established for each unit operation and each CQA. For biopharmaceutical manufacturing processes this usually sums up to 10 or more unit operations and 10 or more CQAs.

Figure 1: Acceptance criteria need to be defined for each UO and each CQA in order to judge if experiments show critical results or not

Why the 3 SD approach to set acceptance criteria is flawed?

A historically applied approach to establish these boundaries is to take x-SD (most commonly 3 SD) around the mean of historical manufacturing runs. Those runs are usually conducted at the set point (SP) conditions of the process. 
At the time of process development or process characterization, i.e. in the early phase of a process life cycle, only a limited, e.g. 3-9 runs, of manufacturing runs are typically available. From those runs 3 SD, here depicted as the error bars, can be calculated:

These limits are taken as acceptance criteria for all subsequent runs in process development and characterization, typically performed at small scale. 

In case small scale data is “representative” to large scale (see ICH Q10) no offset and equal variances exist between large and small scale.

Purposeful deflection of process parameters is introduced in small scale to identify the mean impact on the CQAs, shown as the solid black line.

In order to account for model uncertainty and residual variance we need to build an uncertainty interval around the regression mean trend. Without comparing apples and oranges, we also need to take xSD - or some representative tolerance interval - to account for the same variability as we did when we calculated variability of the large scale data. These uncertainty intervals are shown as black dashed lines:

What becomes immediately obvious is that the only allowed control strategy is to run the process at set point conditions and no deflection would be acceptable. 

Of course, such as control strategy is not feasible in operations since deflections from set point conditions occur frequently and would lead to an enormous amount of deviations that need to be managed. 

Why is this flawed approach still found in filings?

There are mainly two (flawed) reasons why practically feasible still control strategies are still established using this approach:

Flaw 1

People are comparing apples and oranges: e.g. model uncertainties are expressed as confidence intervals (CI) and not tolerance intervals (TI) and then compared to 3 SD. Confidence intervals describe the uncertainty around the mean and they approach the mean trend (black solid line) in case large number runs are available. Obviously, such confidence intervals will always lead to a wide control strategy and are statistically incorrect. Although the name is misleading, the same is true for prediction intervals, which cover only the uncertainty about the next future observation. In contrast to that we want to make statements about the future population of manufacturing runs, i.e. demonstrating that a fast majority of future runs will fall within specifications. For this purpose only tolerance intervals (TI) are statistically suited.
 

Flaw 2

Small scale models are not representative, i.e. show a lower variability than large scale. In this is case the formed tolerance interval (black dashed line) only represents the variability of the small scale and neglects the variability of the large scale. Hence, without a separate consideration if the mean and variance of small and large scale are comparable the control strategy is not valid for further manufacturing. 

A smart approach to derive intermediate acceptance criteria

How to overcome these flaws using sound statistical approaches?

First have a look at a parallel coordinates plot that can be produced using PAS-X Savvy. On the x-axis we see the sequence of process steps ranging from the first unit operation (UO) until the drug substance. The y-axis shows a specific concentration of a CQA, here an impurity. Each line corresponds to one batch that has been processed through the entire chain of UOs. This plot is useful in many aspects, such as demonstrating where the main clearance of an impurity takes place, i.e. in this case in UO 6. This time I want to use the plot to point out that each output of a specific unit operation – also called pool value -  is the input – also called load – of the next unit operation. 

Having this idea in mind we can also represent the data in a regression way, where the pool value is predicted by the load value. First let’s focus on the end of the process, i.e. UO 3 of this simple example, where drug substance specifications exists. We can make use of the regression model to predict what would be acceptable load values of UO 3  to reach drug substance specifications. As the load of UO 3 equals the pool of UO 2 we have found the acceptance criteria for pool of UO 2. This very simple approach can be iteratively applied for UO 2 and UO 1 to reach their respective acceptance limits. For more details on this approach, please take a look at our publication (Marschall et al., 2022).

Obviously, statistics is a bit more complicated, as we need to take model uncertainty into account around each model. Additionally we also want to include the impact of process parameters onto the (quality) output of each unit operation. This is why integrated process models (IPMs) need to be used to address this task in a scientifically sound manner. 

Conclusion

  • Commonly used x-SD, e.g. 3SD, boundaries used to set acceptance criteria are flawed since then following a sound approach only set point conditions are allowed for control.
  • Two common flaws consist of comparing inappropriate statistical intervals, such as the confidence intervals, to acceptance criteria derived from 3SD. Another flaw consists of not looking at differences of the mean and variance of small and large scale.
  • We have demonstrated a statistical sound approach to derive acceptance criteria not from x-SD but using a backward calculation procedure within an Integrated Process Model (IPM) framework. Using this approach, a control strategy can be established that really ensures reaching drug substance specifications with a large fraction of future manufacturing runs. 

Learn more

Comments

No comments

Write comment

* These fields are required

Back to top
Back to top