Solutions

We have a solution for everything – and the corresponding experience. In our current seven areas of expertise, we are at your disposal with our comprehensive know-how.

All Solutions

Software solutions

Software solutions

With our Werum PAS-X MES - on premise or cloud-based - and our software solutions for analysis, track & trace, networked factories, and intelligent packaging, we are the world's leading supplier and partner to the pharmaceutical and biotech industries.

Overview Software solutions

Handling systems

Handling systems

We are specialists for complete handling systems for pharmaceutical and medical products. Our solutions are decisive in the field of contactless and safe transport of e.g. glass syringes.

Overview Handling systems

Inspection machines

Inspection

As the world's leading inspection expert, we develop solutions for the pharmaceutical and biotech industries. Our range of products extends from high-performance machines and semi-automatic machines to laboratory units and inspection applications for in-process control.

Overview Inspection

Machine finder

Packaging machines

Packaging machines

We are a leading supplier of packaging machines for liquid and solid pharmaceutical and medical products. With our blister, sachet and stick packaging machines we offer solutions for primary packaging. Our side and topload cartoners set standards worldwide for secondary packaging.

Overview Packaging machines

K.Pak Topload Case Packer

Introducing our latest solution from Körber; the K.Pak Topload Case Packer! Created specifically for the pharmaceutical industry, the K.Pak solution provides operator-friendly machines to complete any production line. Our solution focuses on innovative technology, high-quality design and expert handling and packaging of your product. It’s time to start connecting the dots with Körber!

Packaging solutions

Packaging solutions

As long-standing specialists, we develop packaging solutions for innovative and high-quality secondary pharmaceutical packaging made of cardboard. We offer you solutions for counterfeit protection, standard folding boxes and much more.

Overview Packaging solutions

Consulting

Consulting

Our experts will advise you during the analysis of your requirements, show you optimisation potential and support you during the implementation of projects in all areas of the pharmaceutical, biotech and medical device industry.

Overview Consulting

Ignasi Bofarull-Manzano

Blog

Advantages of digital twins along the pharmaceutical product life cycle

In the dynamic landscape of pharmaceutical manufacturing, the integration of cutting-edge technologies is reshaping industry standards. In this article, we unravel the groundbreaking potential of end-to-end digital twins, also known as Integrated Process Models (IPM), that are redefining the (bio-)pharmaceutical industry's future. From enhanced manufacturing flexibility to accelerated time-to-market, we illustrate how these dynamic tools redefine decision-making in real-time. Additionally, we explore the synergy achieved by integrating digital twins with MES software, unlocking opportunities for real-time batch control and release.  

Digital twins were first defined in 2002 by Dr. Michael Grieves at the University of Michigan. Over the past few years, this term has gained widespread attention across numerous industries, including the pharmaceutical industry. But what exactly is a digital twin, and how are they revolutionizing the pharmaceutical landscape?  

There are many definitions of digital twins available, but one that particularly resonates with us is the one put forth by IBM¹. According to their definition, a digital twin is described as a “virtual representation of an object or system that spans its lifecycle, is updated from real-time data, and uses simulation, machine learning, and reasoning to enhance decision making". IBM’s perspective emphasizes that digital twins are more than just extensive simulation models. They are dynamic tools, which continuously learn from new data, predict future outcomes, and suggest preemptive actions - vastly amplifying efficiency, reducing risks, and enhancing overall performance.

In the realm of process modeling and manufacturing digital transformation, digital process twins can be either specialized for specific unit operations or be holistic, spanning the full spectrum of the production journey. This article will delve into the benefits of the latter approach, known as end-to-end digital twins or Integrated Process Models (IPM), in the biopharmaceutical industry.  

The goal of any biopharmaceutical manufacturing process is to ensure product efficacy and patient safety on a continuous basis while maximizing yield. This is defined by the quality of the drug substance/drug product achieved at the end of the process. However, biopharmaceutical manufacturing processes typically consist of five to ten different unit operations. Therefore, how can the performance of intermediate unit operations be linked to the final product quality? How can we identify the unit operations that have the greatest impact on product quality, enabling us to allocate more resources accordingly? Do we necessarily require models of equal accuracy for all unit operations? These critical questions can only be addressed by adopting a holistic approach that encompasses the manufacturing process from end-to-end, integrating all unit operations under a unified model.

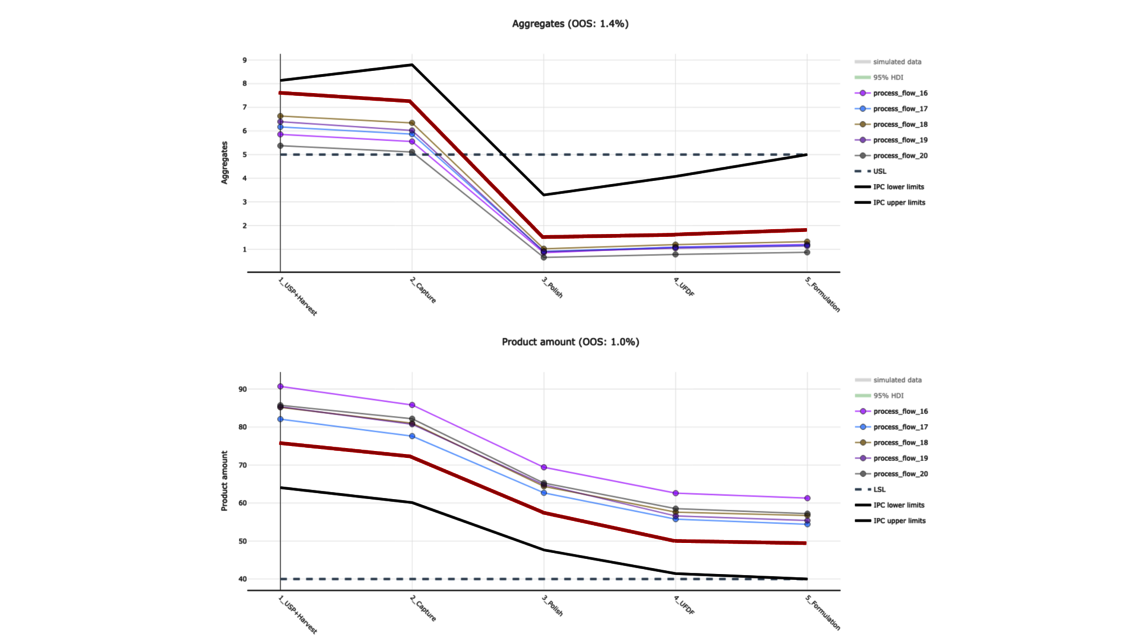
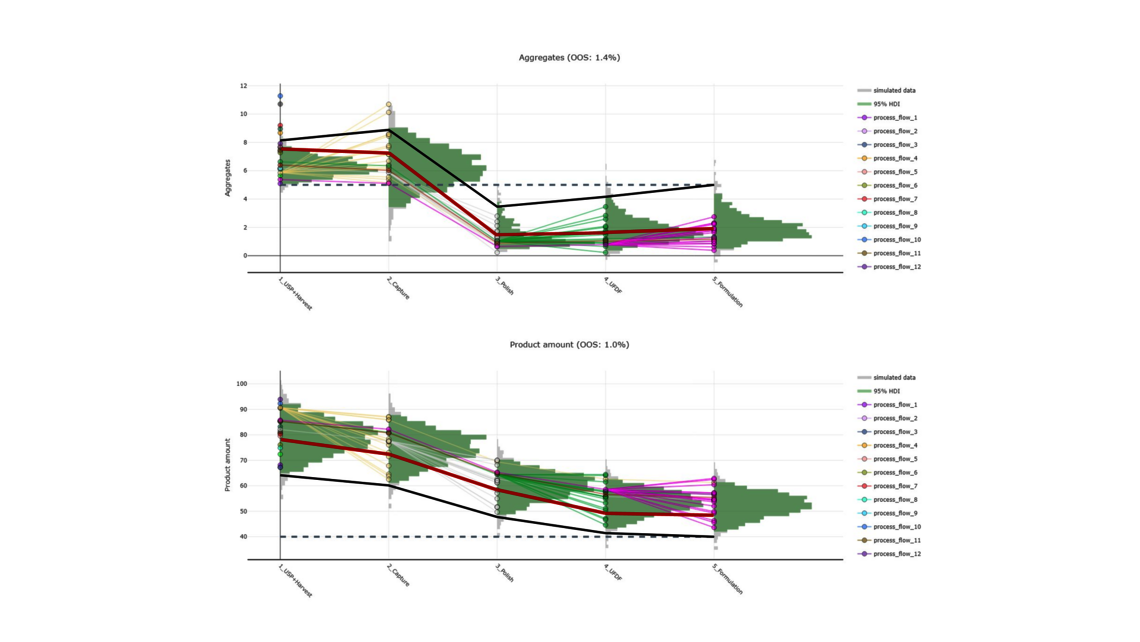
To demonstrate the benefits of end-to-end digital twins in this blog entry, a demo dataset representing a simplified industrial monoclonal antibody (mAb) production process will be used. The dataset comprises five large-scale campaigns across five different unit operations (UOs) and 15 Design of Experiment (DoE) runs per UO, a common dataset size during process validation stage 1 in the biopharmaceutical industry. Two responses will be modeled: Aggregates (a Critical Quality Attribute, CQA) and Product amount (a Key Performance Indicator, KPI).

Higher manufacturing flexibility

Setting up a control strategy during process validation stage 1 in the pharmaceutical industry requires definition of acceptable product quality limits. At drug substance (DS) or product level these limits are well-known and referred to as specification limits. However, it is often unclear how to determine appropriate quality limits for intermediate unit operations, known as in-process control (IPC) limits or intermediate acceptance criteria (iAC). These limits define the quality levels for each unit operation and are therefore the foundation for setting up a control strategy. 

A traditional approach to set up IPCs is by taking three times the standard deviation (SD) around the mean of historical large-scale set-point (SP) runs. This approach has shown to have many drawbacks, such as that these limits have no linkage to the final product quality, they do not account for the effect of process parameters (PPs) variation, or that they strongly depend on the observed variance - penalizing good process control and rewarding bad process control. If you want to learn more about this and other commonly found hurdles in setting up a control strategy, please check our previous blog entry “The biggest flaws in setting a control strategy in biopharmaceutical manufacturing”². 

More sound statistical approaches have also been established for IPCs calculation, including the one developed by Marschall et al.³, which connects different unit operations together and relates the IPCs to DS out-of-specification (OOS) probabilities while considering the manufacturing variability in the process parameters (Normal Operating Range, NOR) and the total clearance capability of the process. This approach uses end-to-end digital twins (hereinafter referred to as integrated process models, IPM) for the IPCs calculation. 

Figure 1 and Figure 2 provide a comparative analysis of the IPCs calculated by the +-3 SD approach and by the IPM for the Aggregates and Product amount responses of the demo dataset. The +- 3SD approach only uses data from the five large-scale manufacturing campaigns for the IPC calculation, whereas the IPM approach utilizes both the large-scale as well as the DoE data (15 runs per UO). For ease of visualization, in Figure 1 only the large-scale runs are shown, while the entire demo dataset and the IPM prediction indicated as distributions are shown in Figure 2. For this demo use case, the DS specifications are set at a maximum of 5 [%] for Aggregates and a minimum of 40 kg for Product amount.

Figure 1: Graphical representation of in-process controls (IPCs) calculation by the 3SD approach (red) as well as by the integrated process model (IPM, black) for Aggregates and Product amount responses. All runs are plotted as individual circles and connected to runs from subsequent UOs. Runs belonging to the same campaign (batch) are connected and share the same colour (process flow). Drug Substance specifications are shown as horizontal dashed grey lines. UO: Unit operation.
Figure 2: Graphical representation of in-process controls (IPCs) calculation by the 3SD approach (red) as well as by the integrated process model (IPM, black) for Aggregates and Product amount responses. All runs are plotted as individual circles and connected to runs from subsequent UOs. Runs belonging to the same campaign (batch) are connected and share the same colour (process flow). Small-scale DoE runs (15 runs per UO) are not continued in the following UO. All DoE runs in one UO share the same starting material, which is one large-scale run. The 3SD approach only uses manufacturing runs targeted at set-point (SP) conditions (Figure 1) for the IPCs calculation, whereas the IPM uses all runs (including the DoE runs) shown in this figure. Drug Substance specifications are shown as horizontal dashed grey lines. UO: Unit operation.

From Figure 2, it can be observed that many DoE runs fall outside the IPCs calculated by the 3SD approach for both responses, due to this method’s exclusive reliance on the variance of available large-scale campaigns, which use to be smaller compared to the effects produced by changing the PPs. Consequently, adhering to this method would result in very tight PARs/Design Spaces when establishing the control strategy for this dataset. However, these results do not necessarily indicate whether the changes in the PPs pose a risk to the final product quality. 

This level of insight can only be achieved through the IPM, which compares the effects of varying the PPs against the performance and normal variation of the process at SP conditions and the required DS specifications at the end of the process. For instance, in the case of Product amount, it can be seen that no DoE run fell outside the IPM’s IPCs. The performance of the large-scale campaigns at SP conditions was significantly distant from the DS specification. As a result, no combination of DoE PPs could lead to a decrease that, if the rest of the UOs are maintained at SP, would result in Product Amount falling below 40 kg at DS. Therefore, a full Proven Acceptable Range (PAR) is expected for this response across all UOs. In the case of Aggregates, only PAR intersections at the USP+Harvest and Capture UOs are anticipated. This is due to the high clearance capacity of the Polish chromatography step, which effectively reduces Aggregates values to within specifications, and the minimal increase in Aggregates in the subsequent UOs UFDF and Formulation.  

Hence, by linking the effect of any process parameter to the final product quality, IPMs enable the establishment of holistic control strategies. These strategies lead to more flexible manufacturing ranges, characterized by wider PARs and Design Spaces. Such increased manufacturing flexibility reduces the out-of-specification (OOS) rates at the end of the process as well as the number of deviations to investigate at intermediate unit operations, thereby effectively streamlining the Continuous Process Verification (CPV) program.

Faster time-to-market

Just as the IPM can predict the OOS probabilities at DS given a certain number of SP campaigns and their variability (Figure 2), it also possesses the capability to suggest how many runs are necessary to achieve certain OOS probabilities. The IPM does that by using the so-called holistic design of experiments (hDoE) algorithm, developed by Oberleitner et al.⁴. The hDoE algorithm strategically recommends which type of runs (spiking or DoE runs), and in which UOs, perform in order to most effectively reduce the DS OOS probabilities. Once the suggested runs are executed, the IPM can be updated and new runs can be suggested if needed, thereby converting the IPM into a self-learning digital twin. This leads to a significant reduction in experimental costs and a faster process development. If you want to learn more about how this technology can reduce the number of experiments needed to reach product commercialization by over 50 percent⁴ ⁵, you can check out our recent blog post

To showcase this property of end-to-end digital twins with our demo dataset, Figure 3 illustrates how the PAS-X Savvy IPM, once trained with the large-scale and the DoE data, it identifies the runs that most effectively reduce the OOS probabilities for Aggregates. For example, the IPM suggests that performing a single spiking (also known as worst-case) run in the Polish UO with an 8 percent Aggregates load could decrease the OOS probability down to 0.2 percent. Therefore, this approach ensures more efficient and targeted experimentation while optimizing the process.

Figure 3: The holistic design of experiments (hDoE) algorithm from PAS-X Savvy Process Models predicts the runs that are optimal to decrease the out of specification (OOS) events at the end of the process by efficiently allocating resources where needed.

Synergic process optimization: the snowball effect

In purification UOs such as chromatography and filtration, a key factor influencing performance is the loading density, that is, the amount of product being processed. The loading density does not only affect the efficiency of the purification UO itself but also impacts how other process parameters (pH, Conductivity, TMP, buffer concentration, etc.) contribute to its efficiency. Moreover, the number of impurities also plays a significant role in the performance of these UOs, particularly at initial stages of the process where impurity loads tend to be higher. 

The loading density and impurity loads in a given UO are intrinsically the result of the performance of all preceding UOs. This implies an interconnection between PPs of different UOs known as multiplicity or snowball effects. For example, altering a parameter in the initial UO, such as increasing the Titer in fermentation, can have cascading effects on subsequent UOs. These interconnected effects between PPs across various UOs can be either synergistic or antagonistic. Therefore, effective process optimization - maximizing yield while keeping impurities within acceptable limits - necessitates accounting for these interconnected effects. Process optimization becomes not just a multivariate problem but also a multi-unit operation optimization challenge. Understanding the true impact of a UO on the final product is only achievable with end-to-end process modeling.

Finally, it's important to recognize that controlled PPs are not the only factors influencing a UO's output. Random variation, stemming from uncontrollable sources such as material attributes, seed trains, resin lots, operator differences, and many more, also plays a significant role. In fact, a recent study from an industrial mAb production process has demonstrated that in some UOs, the impact of random variation may even exceed that of the PPs themselves⁶. Similar to how the load is a direct result of the performance of previous UOs, the random variation in one UO's input is a cumulative effect of the random variation in all preceding UOs. Therefore, models that fail to integrate the variance propagation across the entire process chain risk developing fundamentally flawed control strategies. We will dive deeper into this topic in future blog entries, where we will talk about mixed effects models and their importance in the biopharmaceutical industry. 

Figure 4 showcases the Parameter Sensitivity Analysis (PSA) for our demo dataset, highlighting the impact of varying each PP from the SP (represented as 0 value) within the defined screening range (spanning from -1 to +1). This analysis reveals how these variations influence the OOS probabilities at DS. Notably, the PSA indicates that several PPs may exhibit antagonistic effects between the two investigated responses (e.g. increasing the Cultivation duration in USP+Harvest is beneficial for Product amount but increases the OOS probabilities for Aggregates). At the same time, changing the SP value of a single PP could significantly alter the PSA profile of other PPs within the same UO as well as of subsequent UOs, demonstrating the 'snowball effect'.

Figure 4: Parameter Sensitivity Analysis (PSA) for the responses Aggregates and Product amount in the demo dataset. This figure illustrates the impact on out-of-specification (OOS) probabilities at Drug Substance (DS) when each process parameter (PP) is varied within the screening range (-1 to +1), while keeping all the other PPs at set-point (SP) conditions (0 value).

Real-time batch control and release

Integrating end-to-end digital twins with manufacturing execution system (MES) software, such as Körber’s PAS-X MES Suite, combined with Process Analytical Technology (PAT) systems for seamless real-time data exchange, unlocks a variety of opportunities. This powerful combination paves the way for adaptive control, real-time monitoring and release, and AI-driven recommendations, leading us towards the realization of smart manufacturing and the core principles of Industry 4.0. 

A prime example of this integration's potential is illustrated in Video 1, showing PAS-X Savvy Process Models coupled with PAS-X MES and being used as a recommender system for adaptive control during manufacturing. In the shown example, an operator first registered a deviation in the Seeding Density PP from the SP conditions during Fermentation (orange colored PP). In response, the IPM predicted which would be the new OOS probability at the end of the process due to this unforeseen event and suggested a series of adjustments in the subsequent UOs in order to revert the deviation and realign the process within accepted OOS probability rates (green colored PPs). The recommendations were reviewed by the Subject-Matter Expert (SME) who approved and forwarded them to the MES for their implementation.

Given the myriad advantages of integrating end-to-end digital twins with MES software, we will dedicate separate blog entries to delve deeper into this topic and provide insights on how to effectively implement them in Good Manufacturing Practice (GMP) environments.

We require your consent

This video is hosted by YouTube, provided by Google LLC (US). If you proceed to access the video, YouTube will receive your IP address, may place cookies on your device and may link this activity with your user account. For further information, please refer to our privacy policy. Your consent will be stored for all YouTube-videos. You may withdraw your consent at any time via the cookie settings page.

OK

Video 1: Example of PAS-X Savvy Process Models in combination with PAS-X MES being used as a recommender system for adaptive control in manufacturing. An operator registered a deviation in the Seeding Density process parameter (PP) from the set-point (SP) conditions during fermentation. In response, the IPM predicted the new out-of-Specification (OOS) probability at the end of the process due to this unforeseen event and suggested a series of adjustments in the subsequent UOs to revert the deviation and realign the process within accepted OOS probability rates. The recommendations were reviewed by the Subject-Matter Expert (SME) who approved and forwarded them to the MES for their implementation

Conclusion

The incorporation of end-to-end digital twins or integrated process models (IPM) in the pharmaceutical industry brings forth multitude of advantages:

  • Faster time-to-market: By efficiently allocating resources where needed, end-to-end digital twins reduce the need for extensive experimental efforts, enabling faster product development and commercialization
  • Enhanced manufacturing flexibility: With a holistic view of the entire process and wider manufacturing ranges (PARs/Design Spaces) at the right spots, end-to-end digital twins lead to lower out-of-specification (OOS) rates, fewer deviations to investigate, and streamlined Continuous Process Verification (CPV) programs.
  • Higher yield and quality with multivariate & multi-unit operation optimization: Learn the synergies of your process, unveil the snowball effect. 
  • Breaking knowledge silos: End-to-end digital twins foster collaboration and knowledge-sharing across different departments and process development stages, eliminating vertical and horizontal silos within the organization.
  • Improved deviation management: Digital twins provide real-time insights and data, enabling proactive deviation management and data-based justifications for regulatory authorities.
  • Real-time batch control, release & increased product shelf-life: Integrating end-to-end digital twins with MES software and PAT systems allows for adaptive control strategies, continuous monitoring and AI-based recommendations, enabling dynamic and data-driven decision-making.

Stay tuned for our next posts, as we delve deeper into the transformative impact of end-to-end digital twins in the biopharmaceutical industry! At Körber, we take pride in being a digital twin factory, leveraging cutting edge technology to revolutionize the pharmaceutical manufacturing.

If you have any questions or need further assistance, we are here to help. Use our contact form, or get in touch with one of our experts at:

info.pasx-savvy@koerber.com

We look forward to hearing from you.

Get in touch

Factsheet: Integrated process modelling with Werum PAS-X Savvy

With its breakthrough innovation Process Models (PMs), Werum PAS-X Savvy enables a holistic control strategy, deviation management and batch release in real time

Download

  1. What is a digital twin? | IBM. https://www.ibm.com/topics/what-is-a-digital-twin.
  2. The biggest flaws in setting a control strategy in biopharmaceutical manufacturing. Körber Pharma https://www.koerber-pharma.com/blog/
    the-biggest-flaws-in-setting-a-control-strategy-
    in-biopharmaceutical-manufacturing
    .
  3. Marschall, L. et al. Specification-driven acceptance criteria for validation of biopharmaceutical processes. Front. Bioeng. Biotechnol. 10, (2022).
  4. Oberleitner, T., Zahel, T., Pretzner, B. & Herwig, C. Holistic Design of Experiments Using an Integrated Process Model. Bioengineering 9, 643 (2022).
  5. How to reduce time to market by >50%. Körber Pharmahttps://www.koerber-pharma.com/blog/
    how-to-reduce-time-to-market-by-50-percent
    .
  6. Oberleitner, T., Zahel, T., Kunzelmann, M., Thoma, J. & Herwig, C. Incorporating random effects in biopharmaceutical control strategies. AAPS Open  9, 4 (2023).

That might also be interesting for you:

How to reduce time to market by >50%

The biggest flaws in setting a control strategy in biopharmaceutical manufacturing

Successful process characterization in biotech: A how-to-guide in 7 steps

Comments

No comments

Write comment

* These fields are required

Back to top
Back to top